- Home
- About Us
- Service
- Application
- Technology
- Resource
- Contact Us

miRNA Sequencing(Human/Mouse/Rat)
MicroRNA (miRNA) sequencing employs next-generation sequencing (NGS) to identify and quantify miRNAs, crucial regulators of gene expression. This technique supports diverse applications including cancer research, developmental biology, diagnostics, and therapeutic targeting, offering insights into disease mechanisms and potential treatments.
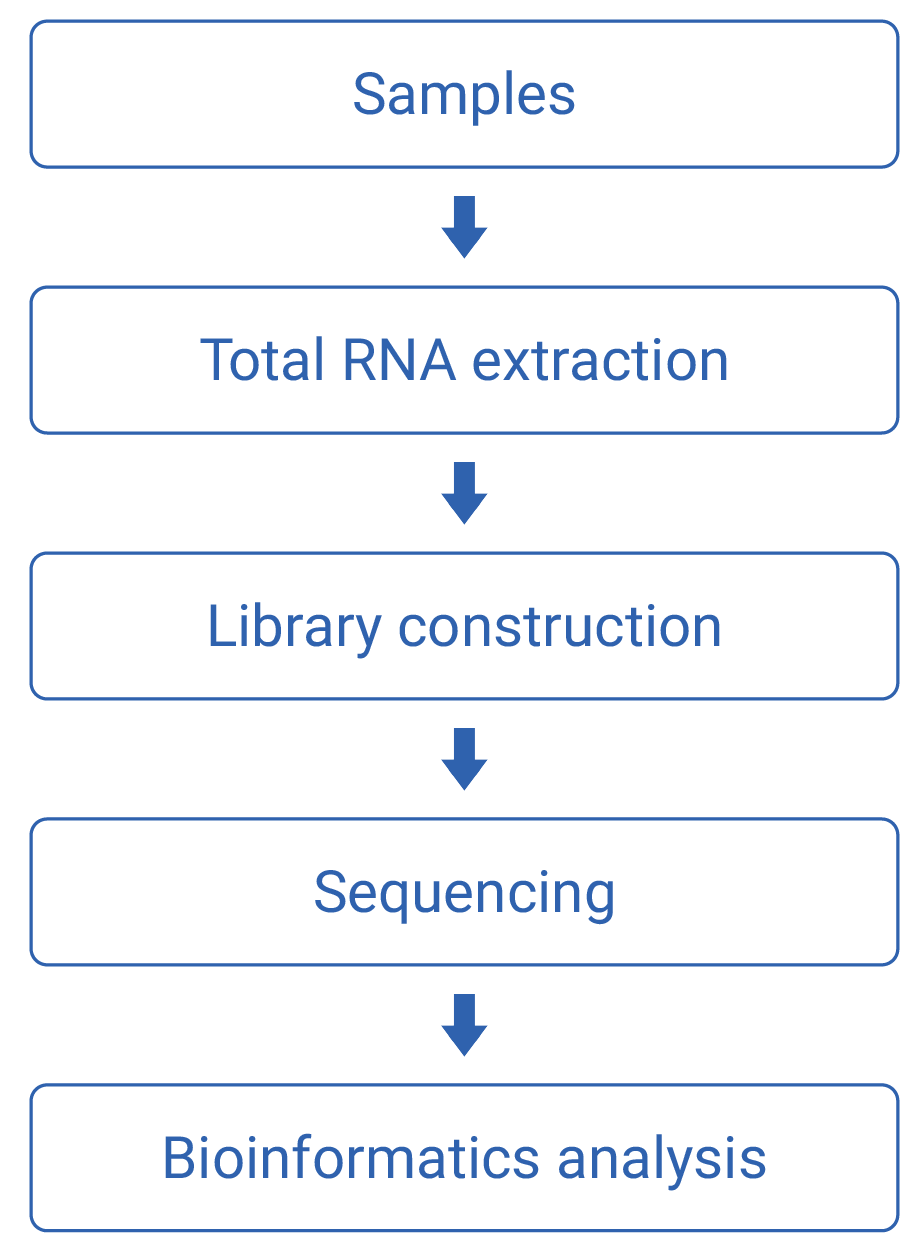
Work flow
Technical Parameters
| Sequencing range | miRNA |
| Sequencing strategy | NGS PE150 |
| Sequencing throughput | 3Gb (10M reads) |
| Data quality | Fastq files, Q30≥85% |
| Data analysis | Standard analysis |
| TAT | Standard: 35 WD |
Applications
| Cancer Diagnosis and Prognosis | Therapeutic Target Identification | Viral Infection Studies |
| Biomarker Discovery | Developmental Biology | Environmental Impact Research |
Bioinformatics Analysis
1.Data Quality Control: Remove adapter contamination and low-quality reads from the raw data.
Reference Genome Alignment: Statistics of alignment results, display of alignment region distribution, and display of reads distribution on chromosomes.
2.Reference Genome Alignment: Statistics of alignment results, sRNA chromosomal distribution, and exon-intron alignment.
3.Known miRNA Identification: Using miRbase database, statistics on known miRNA classification.
4.Novel miRNA Prediction: Using tools like Miranda and RNAhybrid, statistics on novel miRNA classification.
5.sRNA Identification and Statistics.
6.miRNA Expression Quantification.
7.Expression Analysis: Reads count statistics, correlation analysis, TPM (Transcripts Per Million) statistics and analysis, PCA (Principal Component Analysis).
8.miRNA Differential Expression Analysis: Statistics of differential miRNAs, volcanic plots of differential miRNAs, Venn diagrams of differential miRNAs, clustering of differential miRNAs,
9.prediction of target genes for differential miRNAs.
10.Functional Enrichment Analysis of Differential miRNA Target Genes: GO (Gene Ontology) enrichment analysis, GO directed acyclic graph, KEGG (Kyoto Encyclopedia of Genes and Genomes) enrichment analysis, enriched metabolic pathway diagrams, Reactome pathway enrichment annotations, enriched Reactome distribution diagrams.
Advantages
![]() High Sensitivity
High Sensitivity
![]() Comprehensive Coverage
Comprehensive Coverage
![]() Bias-Free Analysis
Bias-Free Analysis